Flying on Instruments with Flight Simulator
by Jonathan M. Stern
Chapter 3
Navigation Charts
En route and instrument approach procedure charts are vital to successful instrument flying in Flight Simulator.
Before you take off, it's always a good idea to know where you're going. That's especially true when you're flying on instruments, for without some navigational references, you'll quickly get lost. Fortunately, aeronautical navigation charts are available.
Such charts are published by the National Ocean Service, a division of the U.S. Department of Commerce's National Oceanic and Atmospheric Administration (NOAA). Some non-government publishers also produce and sell aeronautical charts.
The charts of primary concern to the instrument-rated single-engine airplane pilot are en route low-altitude charts and instrument approach procedure charts.
En Route Low-Altitude Charts
En route low-altitude charts provide information found on the charts included in the Flight Simulator owner's manual (VORs, NDBs, and airports, for instance). En route low-altitude charts also show victor airways, the highways in the sky used for airplane navigation.
Victor airways are nothing more than VOR radials. However, maximum and minimum altitudes are listed to insure that the airplane is at least 1000 feet above the highest obstacle along the route, and at an altitude that allows the airplane to receive the VOR signals. Unfortunately, the design of Flight Simulator makes en route low-altitude charts virtually unusable.
The transmission distance of a real VOR is often not duplicated on Flight Simulator, so that using the victor airways on the charts often does not work. Additionally, many of the VORs printed on the en route low-altitude charts aren't included in the Flight Simulator database.
That's why I recommend en route navigation be done using the charts included in the Flight Simulator owner's manual. These charts also appear, courtesy of SubLOGIC Corporation, in Appendix C of this book.
Using these en route charts may require some experimentation, and occasionally will result in a crash if the terrain is higher than you had anticipated. Generally, however, if you climb 5000 feet above the elevation of your departure or arrival airport, you can safely fly the route.
The Federal Aviation Regulations require that the airplane be operated at least “1,000 feet above the highest obstacle within a horizontal distance of five statute miles from the course to be flown.” To comply with that regulation in Flight Simulator, you'll have to know the height of the highest obstacle within five statute miles of your path—a fact you're not likely to know. If you do know the height of the highest obstacle, however (maybe you're flying in a familiar area), you can choose your altitude accordingly.
Instrument Approach Procedure Charts
Instrument approach procedure (IAP) charts are the other important navigational aid for instrument-rated pilots. The IAP charts show the information you need to approach and land at an airport while flying on instruments.
IAP charts are published in bound regional volumes and distributed every 56 days. Twenty-eight days after they're released, a change notice is distributed. This change notice includes a new chart for each IAP that's altered or has been added since the previous round of publication. Pilots are told of notices to airmen (NOTAMs)—which include the most recent chart changes—when they get their weather briefing, done either in person or over the telephone.
| Because of the time-critical nature of IAP charts, it's vital that the charts reprinted in this book not be used for actual navigation. They will have expired long before this book is sold. |
There are three primary types of instrument approach procedures—VOR, NDB, and ILS approaches. These will be discussed completely in Chapters 5–7.
In recent years, new types of approaches have been developed, including area navigation and microwave. These new types of approaches can't be used on Flight Simulator. In fact, most single-engine airplanes aren't equipped to use these approach methods.
Like the en route low-altitude charts, many of the IAP charts include some navigation aids which are not part of the Flight Simulator database. However, all IAPs reprinted in this book can be flown using some version of Flight Simulator.
Some versions of the program (Commodore, Atari, IBM, and Apple II) don't include the San Francisco database. The IBM version of Flight Simulator doesn't equip the airplane with an automatic direction finder (ADF). An ADF is necessary to use any of the NDB approaches. If your version of Flight Simulator doesn't include an ADF, you can't use the NDB approaches. There's also a restriction when you're using the Macintosh version of Flight Simulator—the ADF on the Macintosh isn't accurate. See Chapter 6 for details.
Around an IAP Chart
Appendix B includes over 125 IAP charts, reprinted from those published by the National Ocean Service. Though their function is explained in great detail in later chapters, let's take a look at the form of an IAP chart.
Margin. Information in the top and bottom margins provides the type of IAP (VORs, for instance), the runway or runways served by the IAP, the city and state of the airport, and the airport's name (which is in print larger than the city and state).
Planview. The planview depicts the navigation aids which are used to arrive at and conduct the instrument approach, including the procedure you should follow if you can't make a landing (called a missed approach procedure). The planview shows courses to be flown, communication frequencies, and other details. Most IAP charts include a solid ring which bounds the area within ten nautical miles of the facility on which the approach is based (the VOR for a VOR IAP, for example). If a dashed ring appears outside the ten-nautical-mile ring, only the area inside the solid ring is drawn to scale.
Profile. The profile depicts minimum, maximum, and mandatory altitudes to be flown for various segments of the instrument approach procedure. If an altitude is underlined, it's a minimum altitude. If the altitude is overlined, it's a maximum altitude. If the altitude is underlined and overlined, it's a mandatory altitude.
Figure 3-1. Instrument Approach Procedure Chart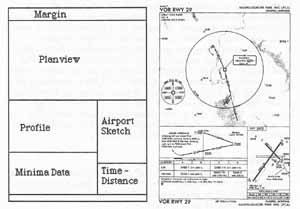
An IAP chart is divided into six sections, each of which provides the instrument-rated pilot with different information.
Airport Sketch. The airport sketch displays the runway pattern, runway numbers, lengths and widths of the runways, mean sea-level elevation of the airport, and lighting associated with each runway.
Minima Data. This provides the minimum altitudes to which you may descend and the minimum visibilities in which the IAP may be executed.
Time-Distance. This section of the chart is used on IAPs where the final-approach facility (say a VOR on a VOR IAP) is some distance from the missed approach point. Times are provided for various groundspeeds so that the pilot knows when to execute the missed approach procedure.
Instrument approach procedure charts and legends are reprinted in Appendix B for use with Flight Simulator. Learning how to read and use IAP charts requires practice. You'll get that practice as you work through Chapters 5–7.
Table of Contents | Previous Section | Next Section